UltimaCalc
Plotting Charts with UltimaCalc
Plotting Charts with UltimaCalc

UltimaCalc provides a simple method to quickly create charts in any sharpe, size, color and complexity to display your data in a more visual format.
Create Charts
- Bar charts, in 2D or 3D
- Stacked bar charts, in 2D or 3D
- Pie charts, in 2D or 3D
- Line charts
- Ribbon charts
- Use any colours you like
- Add hatching or cross-hatching for best black and white photocopying
- Add a title and subtitle
- Automatic generation of an explanatory legend
- The choice of fonts depends only on what you have installed.
- Alter the layout by dragging the various objects in it.
- Save the display as a GIF, PNG, JPG or BMP image file.
- Save the data and layout for future reference.

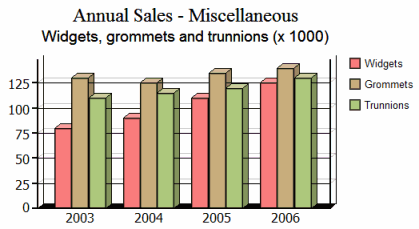
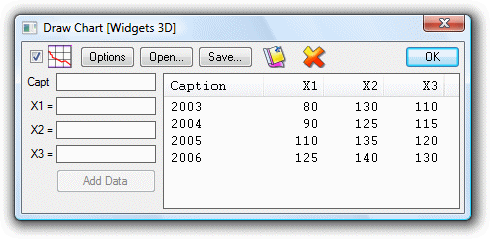
The chart shown above was created by entering data into the window shown below, and clicking on the 'Options' button to set the title, subtitle, labels for the bars, and the fonts. The vertical axis was labelled automatically by UltimaCalc.

The 'Options' button also allows you to choose which kind of chart to display, and to select all relevant settings for the selected chart type.